
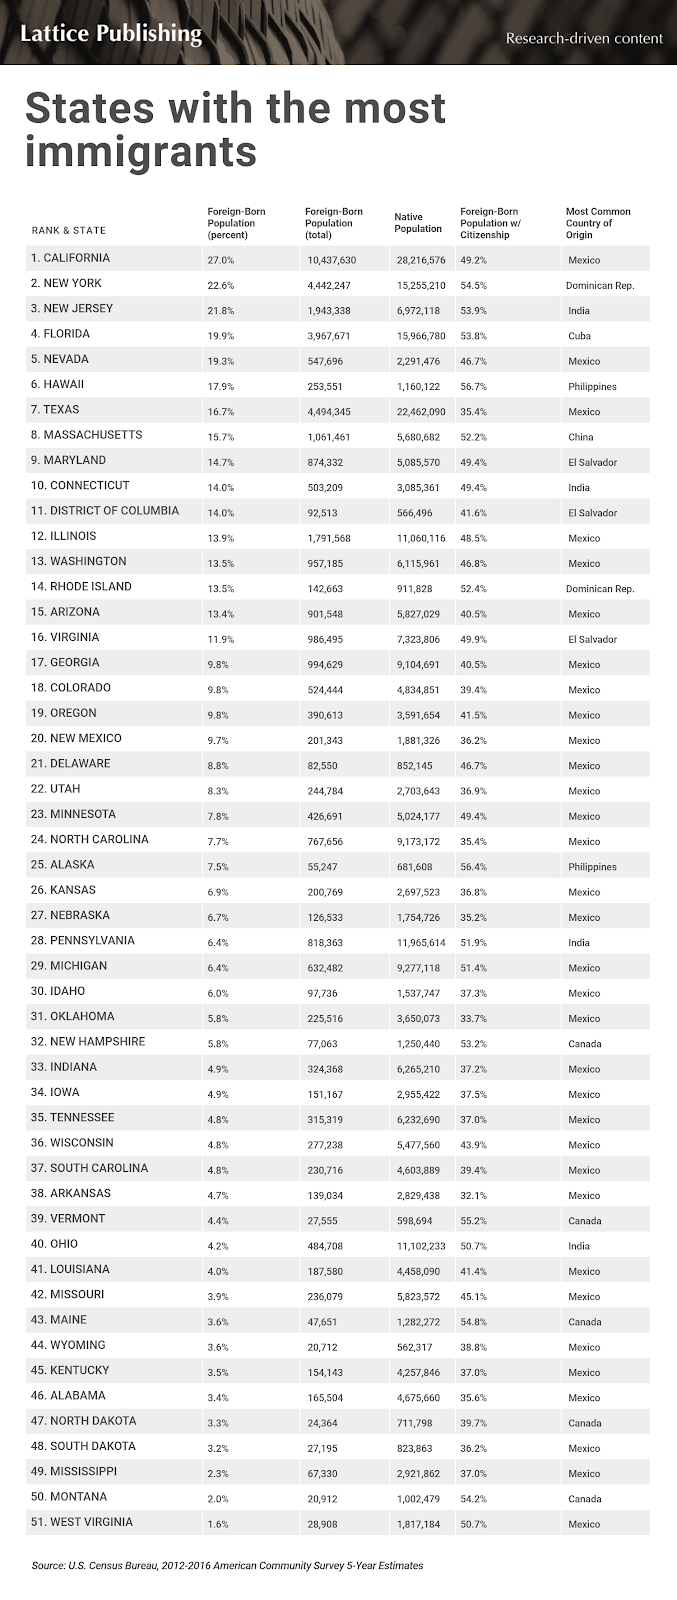
States with the Most Immigrants

Photo Credit: Vlad Ghiea / Alamy Stock Photo
In September 2017, President Trump signed Presidential Proclamation No. 9645, the third iteration of a “travel ban” meant to curtail the entry of foreign nationals from countries deemed to be a threat to national security. The proclamation initially placed restrictions on eight countries—Chad, Iran, Libya, North Korea, Somalia, Syria, Venezuela, and Yemen—but Chad was later removed from the list. According to White House officials, these countries were determined to have an inadequate system for sharing information that would be used in vetting procedures prior to their citizens gaining entry into the United States, and would therefore be subject to the ban.
In the ten months since the proclamation was signed, state and federal courts have challenged it on the grounds of discrimination against Muslim countries. On June 28, 2018, the Supreme Court upheld the travel ban in a 5-to-4 vote, claiming it did not violate the President’s executive powers as outlined in the Immigration and Nationality Act and the U.S. Constitution.
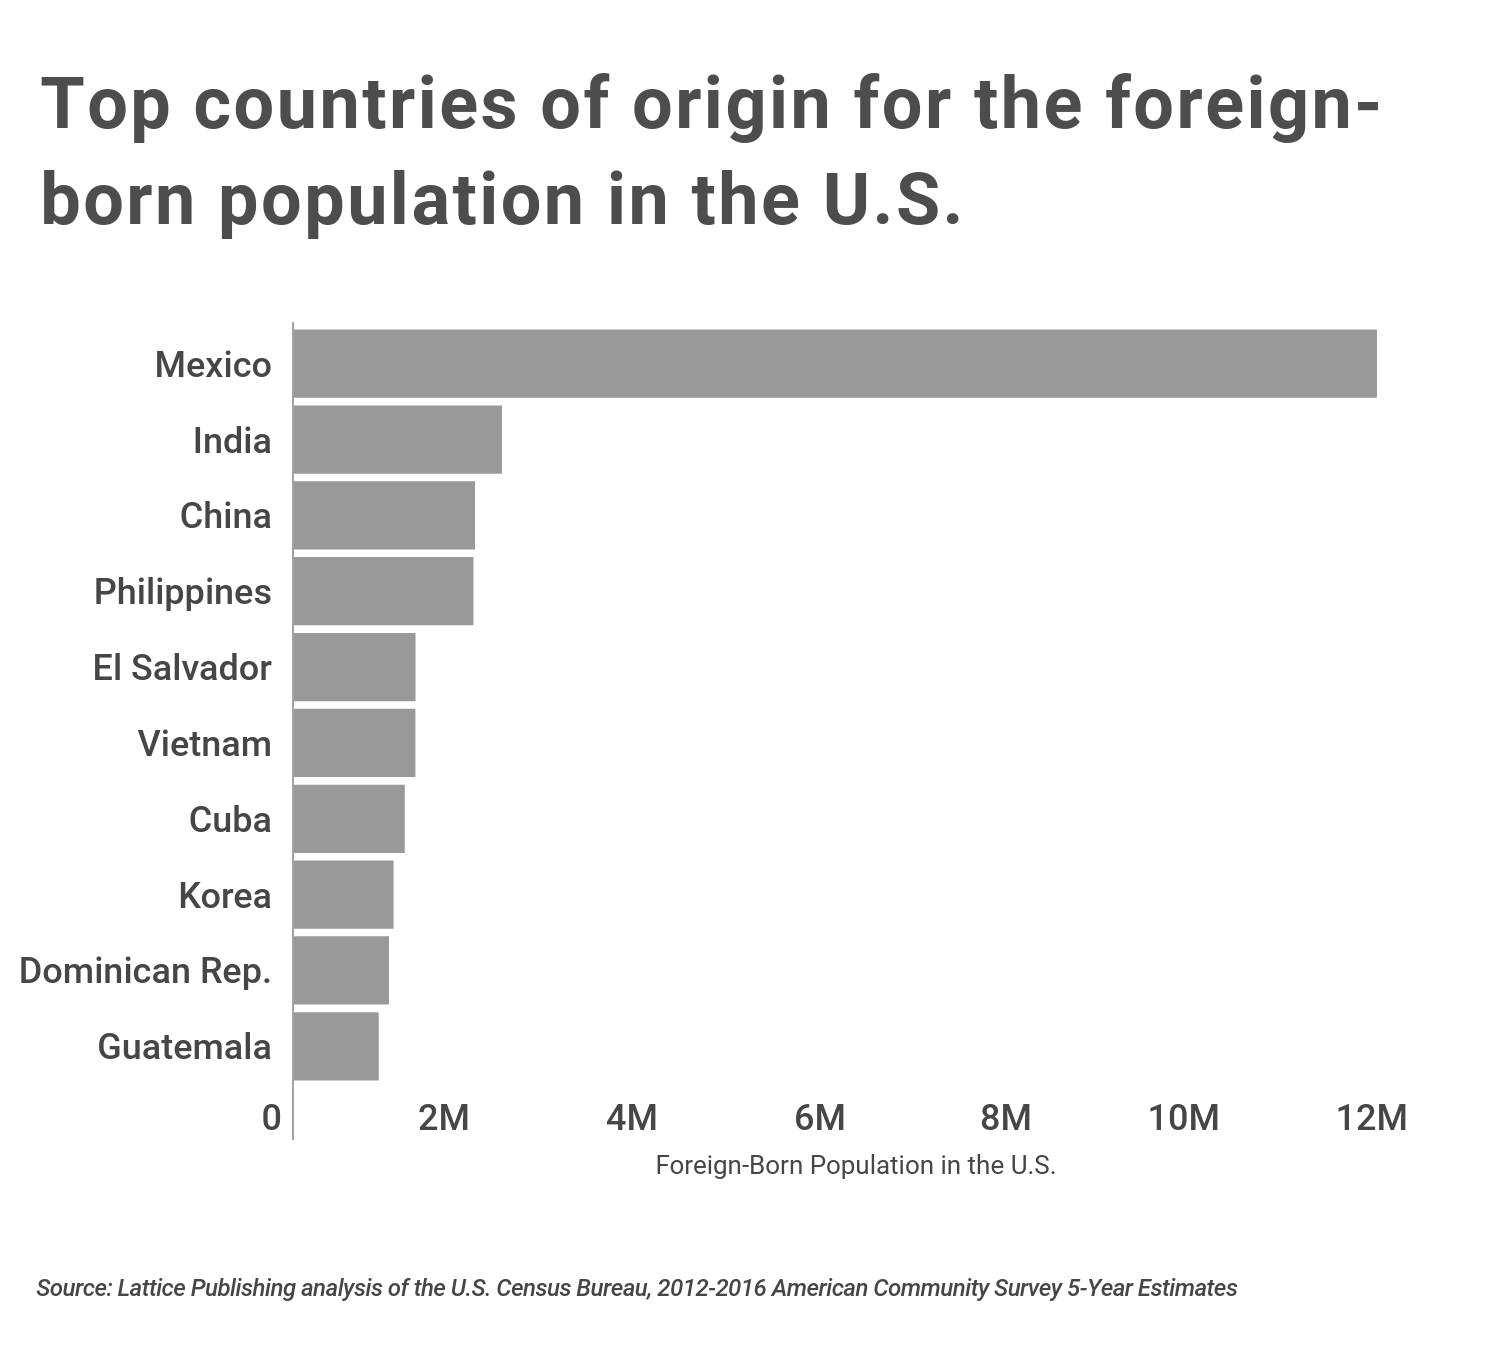
With the topic of immigration at the forefront of today’s news, Lattice Publishing wanted to take a deeper look at how immigration statistics vary across the United States. In 2016, an estimated 1.49 million immigrants entered the United States—a population the size of San Antonio. Currently, approximately 13% of the U.S. population is foreign born (over 42 million people). Of those, slightly less than half are naturalized U.S. citizens. Most immigrants to the U.S. come from countries in Latin America and Asia.
Using data from the U.S. Census Bureau 2012-2016 American Community Survey 5-Year Estimates, researchers at Lattice Publishing ranked the states with the largest foreign-born populations, and also noted the most common country of origin for each state.
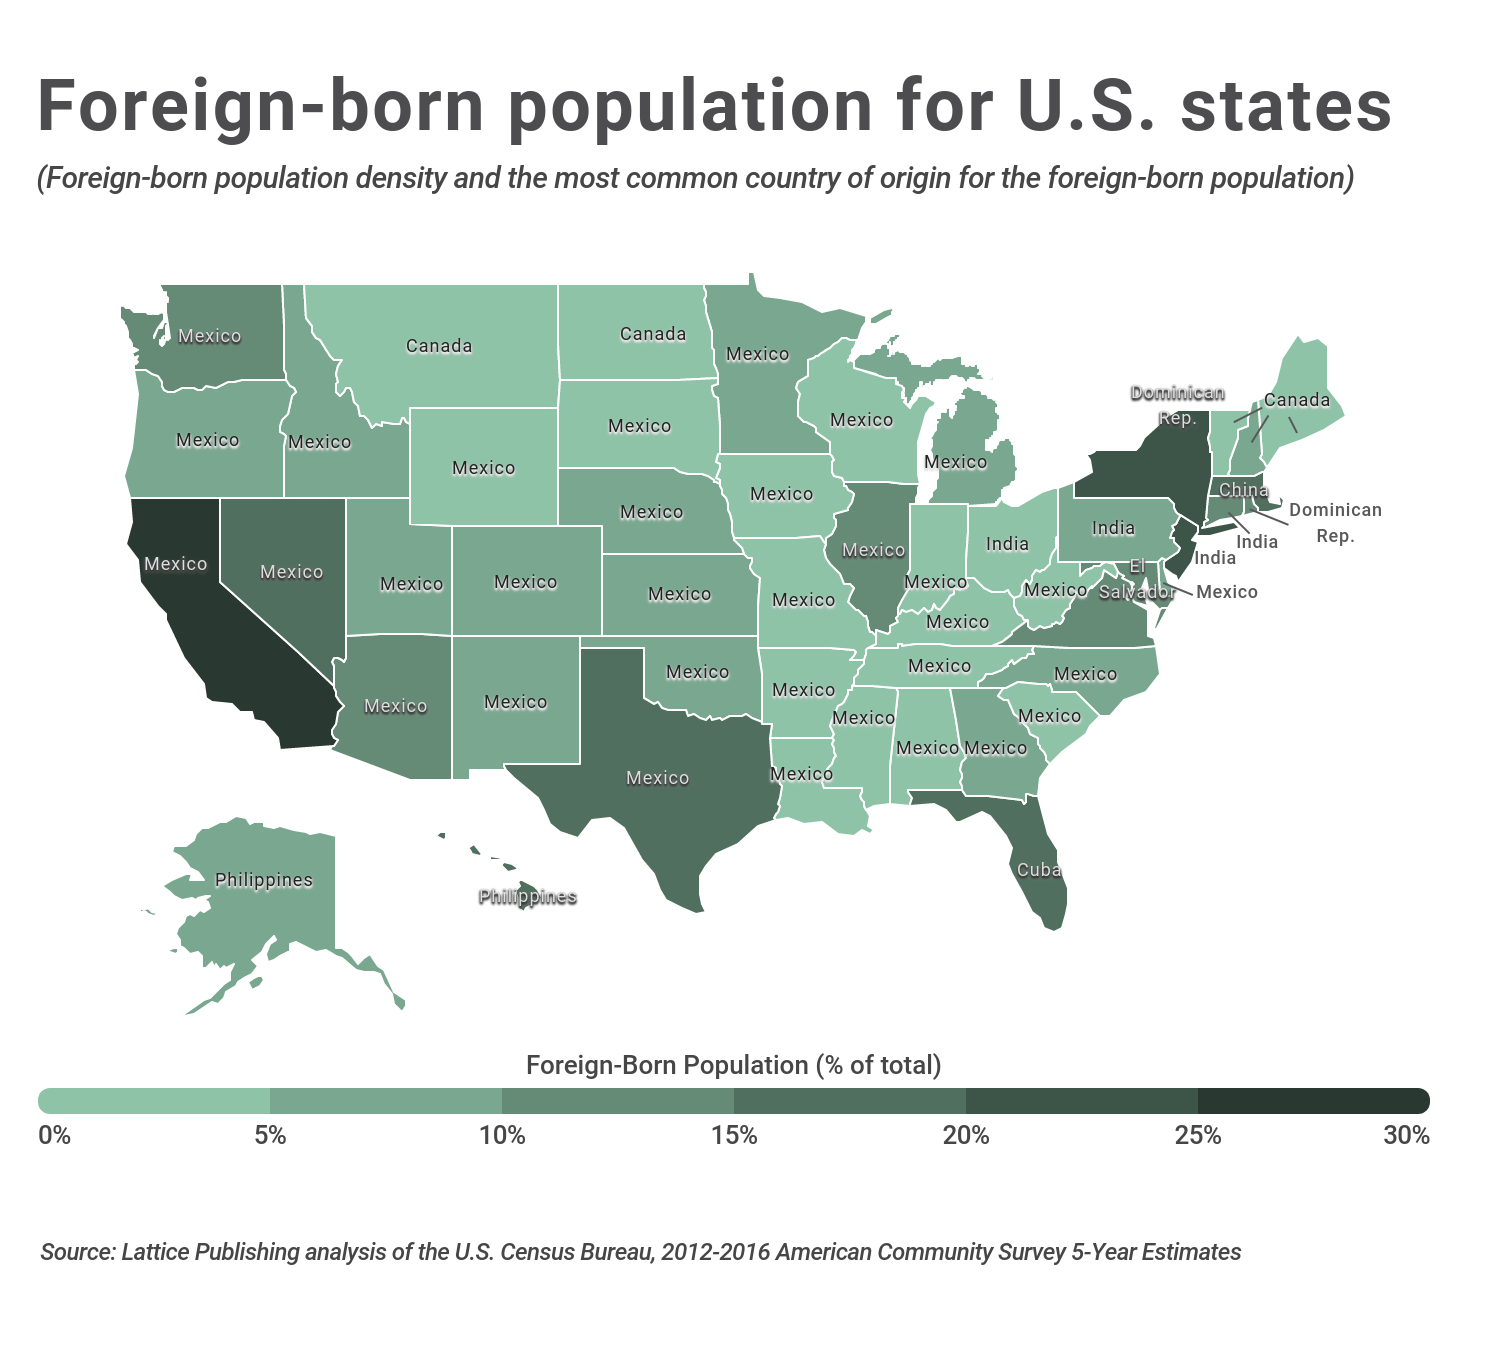
The states with the most immigrants are densely populated and usually located on the coasts, as is the case with California, New York, New Jersey, Florida, and Texas. While Mexico is the most common country of origin for the nation as whole and for most states, states in the Northeast show the greatest diversity across this metric. Below is a list of the 15 states with the largest immigrant populations.
States with the largest foreign-born populations

Photo Credit: Pavelow Productions LLC / Stockimo / Alamy Stock Photo
15. Arizona
- Foreign-born population (percent): 13.4%
- Foreign-born population (total): 901,548
- Native population: 5,827,029
- Foreign-born population w/ citizenship: 40.5%
- Most common country of origin: Mexico

Photo Credit: Sean Pavone / Alamy Stock Photo
14. Rhode Island
- Foreign-born population (percent): 13.5%
- Foreign-born population (total): 142,663
- Native population: 911,828
- Foreign-born population w/ citizenship: 52.4%
- Most common country of origin: Dominican Republic

Photo Credit: Andriy Kravchenko / Alamy Stock Photo
13. Washington
- Foreign-born population (percent): 13.5%
- Foreign-born population (total): 957,185
- Native population: 6,115,961
- Foreign-born population w/ citizenship: 46.8%
- Most common country of origin: Mexico

Photo Credit: incamerastock / Alamy Stock Photo
12. Illinois
- Foreign-born population (percent): 13.9%
- Foreign-born population (total): 1,791,568
- Native population: 11,060,116
- Foreign-born population w/ citizenship: 48.5%
- Most common country of origin: Mexico

Photo Credit: Vlad Ghiea / Alamy Stock Photo
11. District of Columbia
- Foreign-born population (percent): 14.0%
- Foreign-born population (total): 92,513
- Native population: 566,496
- Foreign-born population w/ citizenship: 41.6%
- Most common country of origin: El Salvador

Photo Credit: Sean Pavone / Alamy Stock Photo
10. Connecticut
- Foreign-born population (percent): 14.0%
- Foreign-born population (total): 503,209
- Native population: 3,085,361
- Foreign-born population w/ citizenship: 49.4%
- Most common country of origin: India

Photo Credit: Sean Pavone / Alamy Stock Photo
9. Maryland
- Foreign-born population (percent): 14.7%
- Foreign-born population (total): 874,332
- Native population: 5,085,570
- Foreign-born population w/ citizenship: 49.4%
- Most common country of origin: El Salvador

Photo Credit: Sean Pavone / Alamy Stock Photo
8. Massachusetts
- Foreign-born population (percent): 15.7%
- Foreign-born population (total): 1,061,461
- Native population: 5,680,682
- Foreign-born population w/ citizenship: 52.2%
- Most common country of origin: China

Photo Credit: Incite Photography / Alamy Stock Photo
7. Texas
- Foreign-born population (percent): 16.7%
- Foreign-born population (total): 4,494,345
- Native population: 22,462,090
- Foreign-born population w/ citizenship: 35.4%
- Most common country of origin: Mexico
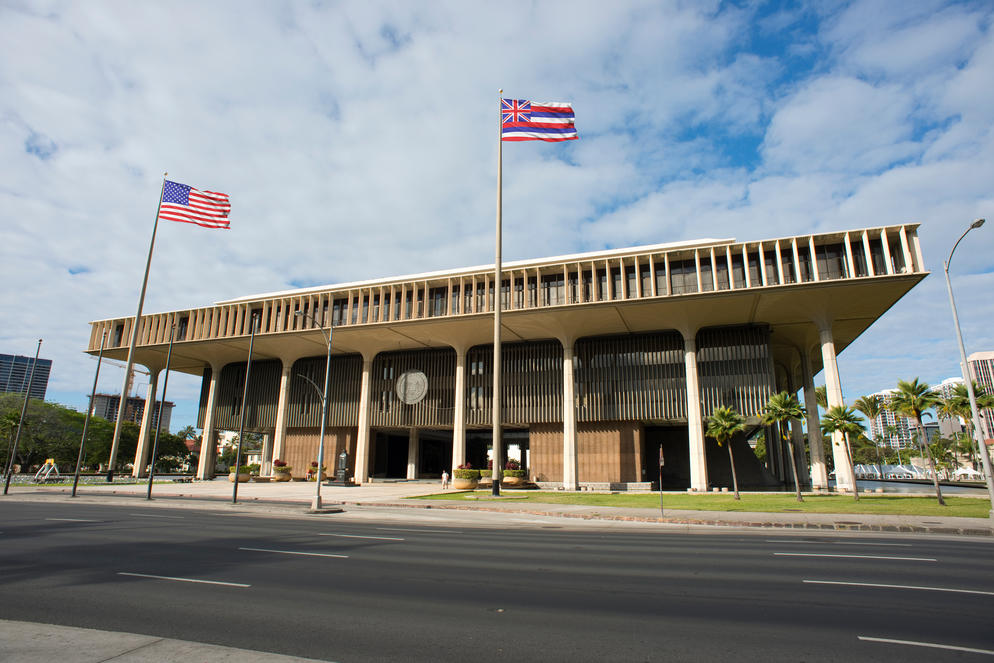
Photo Credit: Panther Media GmbH / Alamy Stock Photo
6. Hawaii
- Foreign-born population (percent): 17.9%
- Foreign-born population (total): 253,551
- Native population: 1,160,122
- Foreign-born population w/ citizenship: 56.7%
- Most common country of origin: Philippines

Photo Credit: lucky-photographer / Alamy Stock Photo
5. Nevada
- Foreign-born population (percent): 19.3%
- Foreign-born population (total): 547,696
- Native population: 2,291,476
- Foreign-born population w/ citizenship: 46.7%
- Most common country of origin: Mexico

Photo Credit: Sean Pavone / Alamy Stock Photo
4. Florida
- Foreign-born population (percent): 19.9%
- Foreign-born population (total): 3,967,671
- Native population: 15,966,780
- Foreign-born population w/ citizenship: 53.8%
- Most common country of origin: Cuba

Photo Credit: Sean Pavone / Alamy Stock Photo
3. New Jersey
- Foreign-born population (percent): 21.8%
- Foreign-born population (total): 1,943,338
- Native population: 6,972,118
- Foreign-born population w/ citizenship: 53.9%
- Most common country of origin: India

Photo Credit: Andriy Kravchenko / Alamy Stock Photo
2. New York
- Foreign-born population (percent): 22.6%
- Foreign-born population (total): 4,442,247
- Native population: 15,255,210
- Foreign-born population w/ citizenship: 54.5%
- Most common country of origin: Dominican Republic

Photo Credit: Sean Pavone / Alamy Stock Photo
1. California
- Foreign-born population (percent): 27.0%
- Foreign-born population (total): 10,437,630
- Native population: 28,216,576
- Foreign-born population w/ citizenship: 49.2%
- Most common country of origin: Mexico
Methodology & full results
The data used in this analysis is from the U.S. Census Bureau 2012-2016 American Community Survey 5-Year Estimates. The term “native born” refers to anyone born in the United States, Puerto Rico, or U.S. Island Area (e.g. Guam), as well as anyone born abroad to at least one U.S. citizen parent. The term “foreign born” refers to anyone who is not a U.S. citizen at birth, including naturalized U.S. citizens, legal permanent residents, temporary migrants, humanitarian migrants, and unauthorized migrants. For each state, the most common country of origin for the foreign-born population is based on total numbers.
More From WNAW AM


